Using One-Signal’s Best Indicators for Day Trading, How Much Profit Can You Make?
ONE-SIGNAL was developed over 10 years ago, following extensive research into the stock market, focusing on historical speculative bubbles and human behaviour as individuals and in masses. As such, our strategy leverages stock market sentiment indicators and our goal is to recognise emotions, such as excessive fear and greed, in every phase of the market. This approach has yielded results that speak for themselves, making our indicators one of the best for day trading.
In this blog, we unpack the ONE-SIGNAL strategy further before taking a look at examples from our day trading performance report, helping you to discover just how much profit you could make with ONE-SIGNAL.
Why are ONE-SIGNAL’S indicators the best indicators for day trading?
Due to our unique approach, the system permanently analyses stock market sentiment to identify sentiment trends. These are then followed until the exaggeration phase before strategically changing direction. The system can thereby anticipate the next movements of mass investors. Our analysis is therefore purely based on sentiment indicators and follows the contrarian investing strategy.
Let’s take a closer look at ONE-SIGNAL’S average performance per annum from 2000 onward:
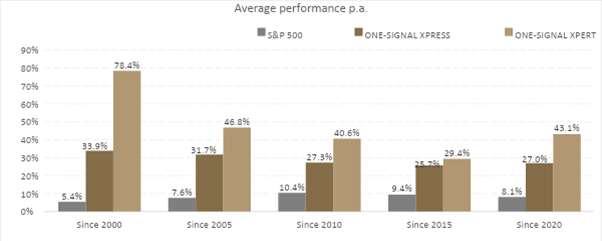
As the graph shows, One-Signal has outperformed the S&P 500 index since its inception, and since 2000, ONE-SIGNAL has outperformed its reference index by 73%. Additionally, in 2022, the S&P 500 index ended the year on a low with -19.6%, whereas ONE SIGNAL Xpress returned 33.1% and ONE-SIGNAL Xpert returned 68.6%.
Now, let’s take a look at how each of these indices has performed since 2010:
![An E-mini simulation line graph showing how the S&P 500, One-Signal Xpress and One-Signal Xpert have performed, comparatively, since 2010.]](https://one-signal.com/wp-content/uploads/2023/03/ONE-SIGNAL-Performance-Since-2010.png)
Considering the above graph, if an individual had invested USD 1,000,000 on the 1st of January 2018 following ONE-SIGNAL’S day trading signals, that investment would have been worth USD 4,254,571 on the 31st of December 2022, which represents a 325% increase over 5 years.
To further illustrate, the table below depicts the returns that were achieved starting from the 1st of January 2018:
| 1st of January 2018 | 1,000,000 USD | |
| until 30th December 2018 | 1,418,285 USD | +41.82% |
| until 30th December 2019 | 1,531,477 USD | +7.98% |
| until 31st December 2020 | 2,022,053 USD | +32.03% |
| until 31st December 2021 | 2,505,742 USD | +23.9% |
| until 30th December 2022 | 4,254,571 USD | +69.79% |
Higher performance, lower volatility
Higher performance and lower volatility makes for the best indicators for day trading
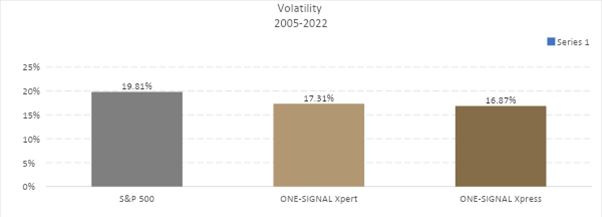
In addition to achieving higher performance, ONE-SIGNAL is also less volatile than its benchmark index. This further enhances the performance of our trading signals, actively demonstrating that we offer the best indicators for day trading.
The below graph indicates the volatility of our trading signals compared to the S&P 500 index, between 2005 and 2022:
What explains ONE-SIGNAL’S day trading signal performance?
ONE-SIGNAL’S clients benefit in every phase of the market, even during times of higher market volatility. The latter implies falling prices of securities, which our system anticipates and therefore delivers SHORT signals accordingly. Long/short investors can choose to follow these trading signals, or if they prefer long-only positions, they can hedge their portfolios. Additionally, profits are reinvested, creating a compound interest effect. Our secret lies in identifying and capitalising on different sentiment cycles.
ONE-SIGNAL’S performance is presented in accumulation, i.e. profits are not withdrawn, but reinvested. Additionally, losses are not covered externally, like the S&P 500. The system’s performance arises without leverage and cost structures, and taxes are not taken into account, as these vary from investor to investor.
Summary: Start earning higher returns with the best indicators for day trading from ONE-SIGNAL
As you can see from these various performance report examples, the ONE-SIGNAL strategy ensures more reliable daily trading signals which yield better trading returns for traders. In the past decade, portfolios entirely based on ONE-SIGNAL have returned an average of over 25% annually, in comparison to the S&P 500, which has returned roughly 7% over the same period.
Accounting for volatility signals, momentum indicators and trade signals at best, ONE-SIGNAL really does offer investors and traders the best indicators for day trading, guaranteeing consistent trading signals and effortless trading returns.
If you would like to try our trading signals in your own trading strategy, start trading now with ONE-SIGNAL or get in touch with our team to find out more.